Help

Sample expression data
-
•Yeast cell cycle on alpha factor arrest (formatted from Eisen et al. experiment)
-
•GSE18115 experiment used in Supplementary Information. You might also find useful this R script to download and re-format the experiment from GEO.
Tutorials
-
• Install and Basic interaction [KEGG] (~10 min.)
-
• Advanced interaction [GO full BP] (~10 min.)
Interface
Voronto has a quite simple interface, which is explained in the visualization, by hovering the different elements. This is a summary of the implemented interactions:
-
• ↑ ↓ Browse ontology hierarchy with up/down arrow keys
-
• ← → Browse expression conditions with left/right keys
-
• ↵ Press enter to expand the current term to whole area
-
• ← Press del to go back, if you previously pressed ↵
-
• s Change color scale (numerical or quantiles)
-
• r Change profile plot for the current hovered term
-
• l Show/hide cell labels (only shown if fitting their area)
-
• b Go back to expression/ontology selection screen
-
• h Open a web browser with this help page
-
• f Show a search text box to find ontology terms or genes
-
• d Show a diffexp search box to find expression patterns
-
• p Print current visualization to an image file
-
• e Exports selected/hovered term’s genes to a text file
-
• Hover a cell to see its name and number of annotated genes
-
• Ctrl+click on a cell to open the browser with its colored pathway (KEGG) or its web entry (GO, Reactome)
-
• Double click to open the gene-level heatmap of a cell. On this heatmap, double click a row name opens its entrez page.
Expression data
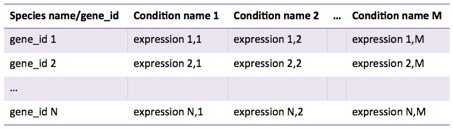
Expression data must be in tab delimited format, as follows:
-
•Species name: must be standard names, such as ‘Homo sapiens’, not ‘H. sapiens’, ‘human’ or ‘hsa’
-
•gene_id: type of identifiers. Supported ids are
-
•entrezgene: Entrez gene ids, e.g. 706585
-
•ensembl_gene_id: Ensembl gene id, e.g. ENSG00000012048
-
•external_gene_id: Specific id for the organism, e.g. YNL220W
-
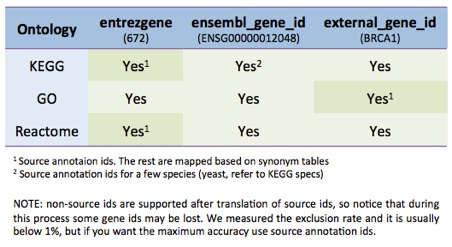
GO and REACTOME mapping works with ‘entrezgene’.
-
KEGG mapping depends on the species, usually ‘entrezgene’, but sometimes it uses ‘external_gene_id’, please check on KEGG webpage.
-
-
•Condition names: free text to describe each condition. It must not include tabs. It is recommended to choose sort descriptors (about 12 characters). It is recommended that conditions have different names.
-
•expression: a numeric value level for the corresponding gene_id and condition name. Decimal separator must be ‘.’
Some recommendations:
-
•Species name and gene_id in the first cell are separated by a slash (‘/’). Leave no blank spaces or tabs between them, just the slash.
-
•Do not insert double tabs or spaces to separate fields. You can use spaces for condition names, but not tabs.
-
•Do not insert blank expression levels, or with non-numeric values such as ‘NA’.
-
•To avoid exceeding Voronto memory limits, with very large data matrices (>5MB), it is recommended to reduce the size by, for example, removing conditions (e. g. averaging replicates) or reducing the number of decimal numbers.
Ontology data
KEGG orthology is a hierarchical controlled vocabulary, where leaves correspond to KEGG pathways. KEGG orthology is parsed from here and updated periodically. KEGG mappings to gene ids are retrieved with the KEGG API, as well as colored pathways.
UPDATE: Now you can also load generic KO_ID data by using KKE/KO_ID instead of organism/gene-id
GO ontology organizes biological terms into three hierarchies: biological process (BP), molecular function (MF) and cellular component (CC). Because it is a vast hierarchy (up to 14 depth levels and thousands of terms, for BP, as of february 2012),
Voronto visualizes just 2 depth-levels of BP.
GO is retrieved from its generic OBO file (http://www.geneontology.org/ontology/obo_format_1_2/) and updated periodically. Only ‘is_a’ relationships are considered.
GO annotations are retrieved from GOA database (http://www.ebi.ac.uk/GOA). IEA and NR evidences are discared.
REACTOME pathway hierarchy is retrieved from OWL files (BioPAX level 3) and entrezgene annotations from biomaRt (bioConductor version). It is a deep (up to 11 levels) ontology, but not as large as GO, so it can be fully visualized.
NOTE: GO and REACTOME are not ‘pure’ hierarchies. Each term can have more than one parent (i.e. ‘cellular metabolic process’ is both a ‘metabolic process’ and a ‘cellular process’). Voronto converts these ontologies to hierarchies by replicating terms (once per parent.)
RECOMMENDATION: Since GO is a huge ontology, it is a good option to load just part of the ontology. You can search a GO term on geneontology.org and download it as an OBO file, and then use it as Custom ontology data (see below.)
Following is a table of gene id compatibility with ontologies (only main organisms, other organisms must have gene ids according to the source annotation format1):
Custom ontology data
Custom ontologies can be generated by following the OBO 1.2 format. Here there is a simple example (you can also try with a real OBO file, such as GO slim). The following restrictions are required:
-
• Entries must be of type [Term].
-
•id and name are required fields for each [Term]. id must be unique in the OBO file
-
•is_a fields must point to the id of any other [Term].
-
•Any other field can be present, but will be ignored by Voronto.
Note OBO files only contain the ontology, gene annotations must be provided by a GAF 2.0 file, with the following specifications:
-
•Only columns 3 (DB Object Symbol) and 5 (Term ID) are required.
-
•Synonyms in Column 11 will be considered, if present.
-
•The remaining columns can be present, but will be ignored.
-
•Empty columns are allowed, but still the tabs must be present to distinguish columns.
Here you can find a sample annotation file for the former simple OBO example and the expression data in the Yeast cell cycle example.
Voronoi tessellation
Voronto implements an additively weighted power (AWP) Voronoi tessellation and a centroidad Voronoi tessellation (CVT) within a recursive algorithm based on [Balzer and Deussen, 2002].
CVT tessellation is an implementation of Lloyd’s algorithm.
AWP tessellation is an adaptation of Takashi Ohyama’s implementation.