Here we present some images of the tool with different examples.
Visual analysis with BicOverlapper
BicOverlapper integrates the visualization of gene expression matrices, biclustering results and biological information (GO terms and transcription regulatory networks) in order to make it easy to analyze microarray experiments. More snapshots of visual analysis and additional features of BicOverlapper soon!
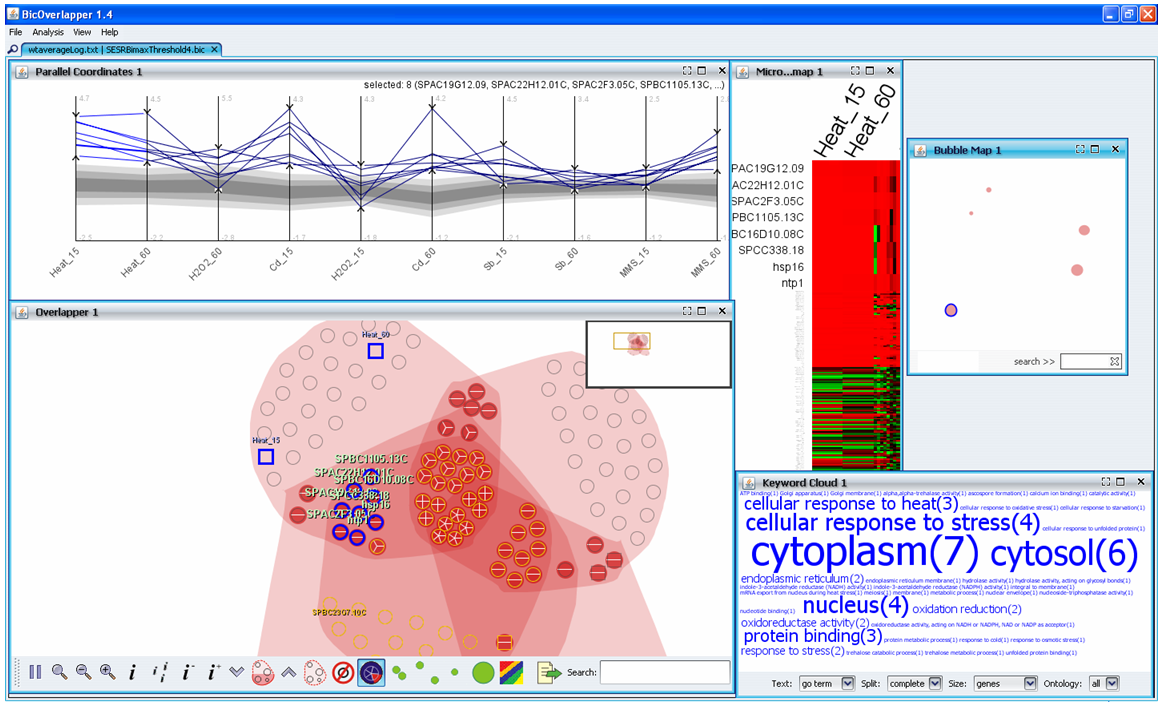
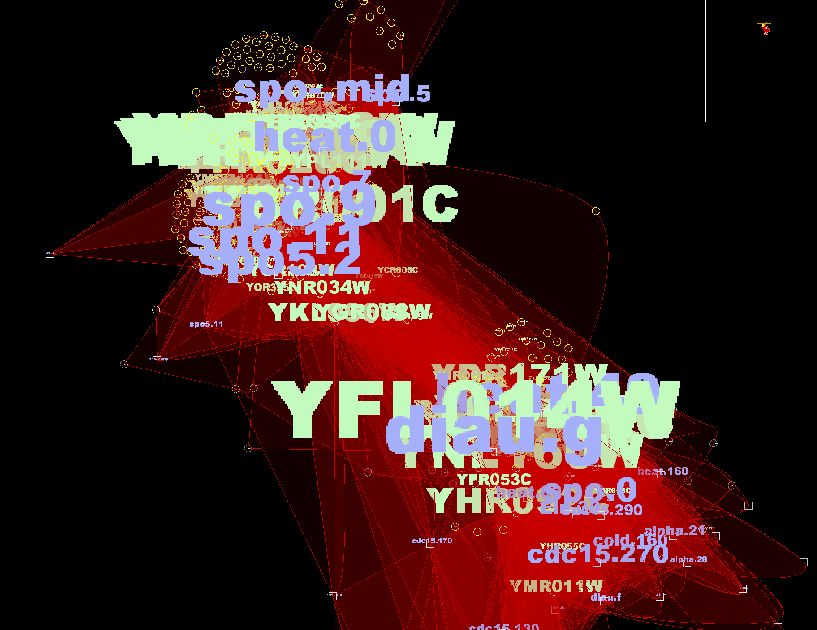
Analysis of data from Chen et al. paper Global Transcriptional Response of Fission Yeast to Environmental Stress (2003). The parallel coordinates and the heatmap visualizes the expression data matrix. Overlapper visualizes 5 biclusters found by the Bimax algorithm for genes high-expressed for one of the 5 considered conditions (they are also visualized on the bubble map at the top right). Overlapper shows their coincidences and allow to further explore genes. For example, the selected genes are related to heat shok but also to another group. BicOverlapper displays the GO terms related to them, showing that all but one are on the cytoplasm.
Bimax on yeast
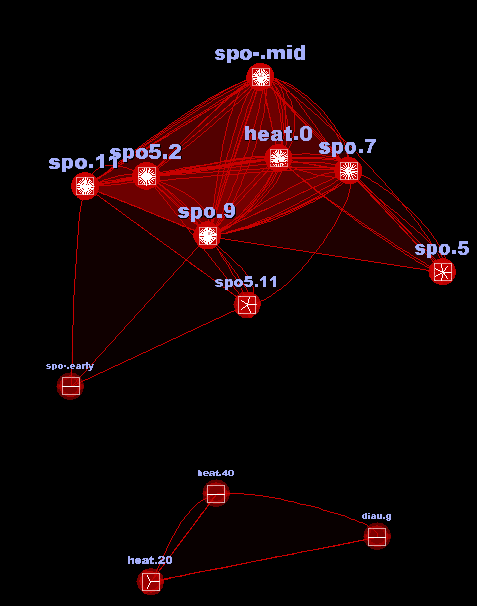
Bimax is an exhaustive biclustering method, finding hundreds of up-regulation constant biclusters on the yeast data. The overlapper reveals two 'superbiclusters', or groups of genes and conditions, that Bimax recurrently groups together
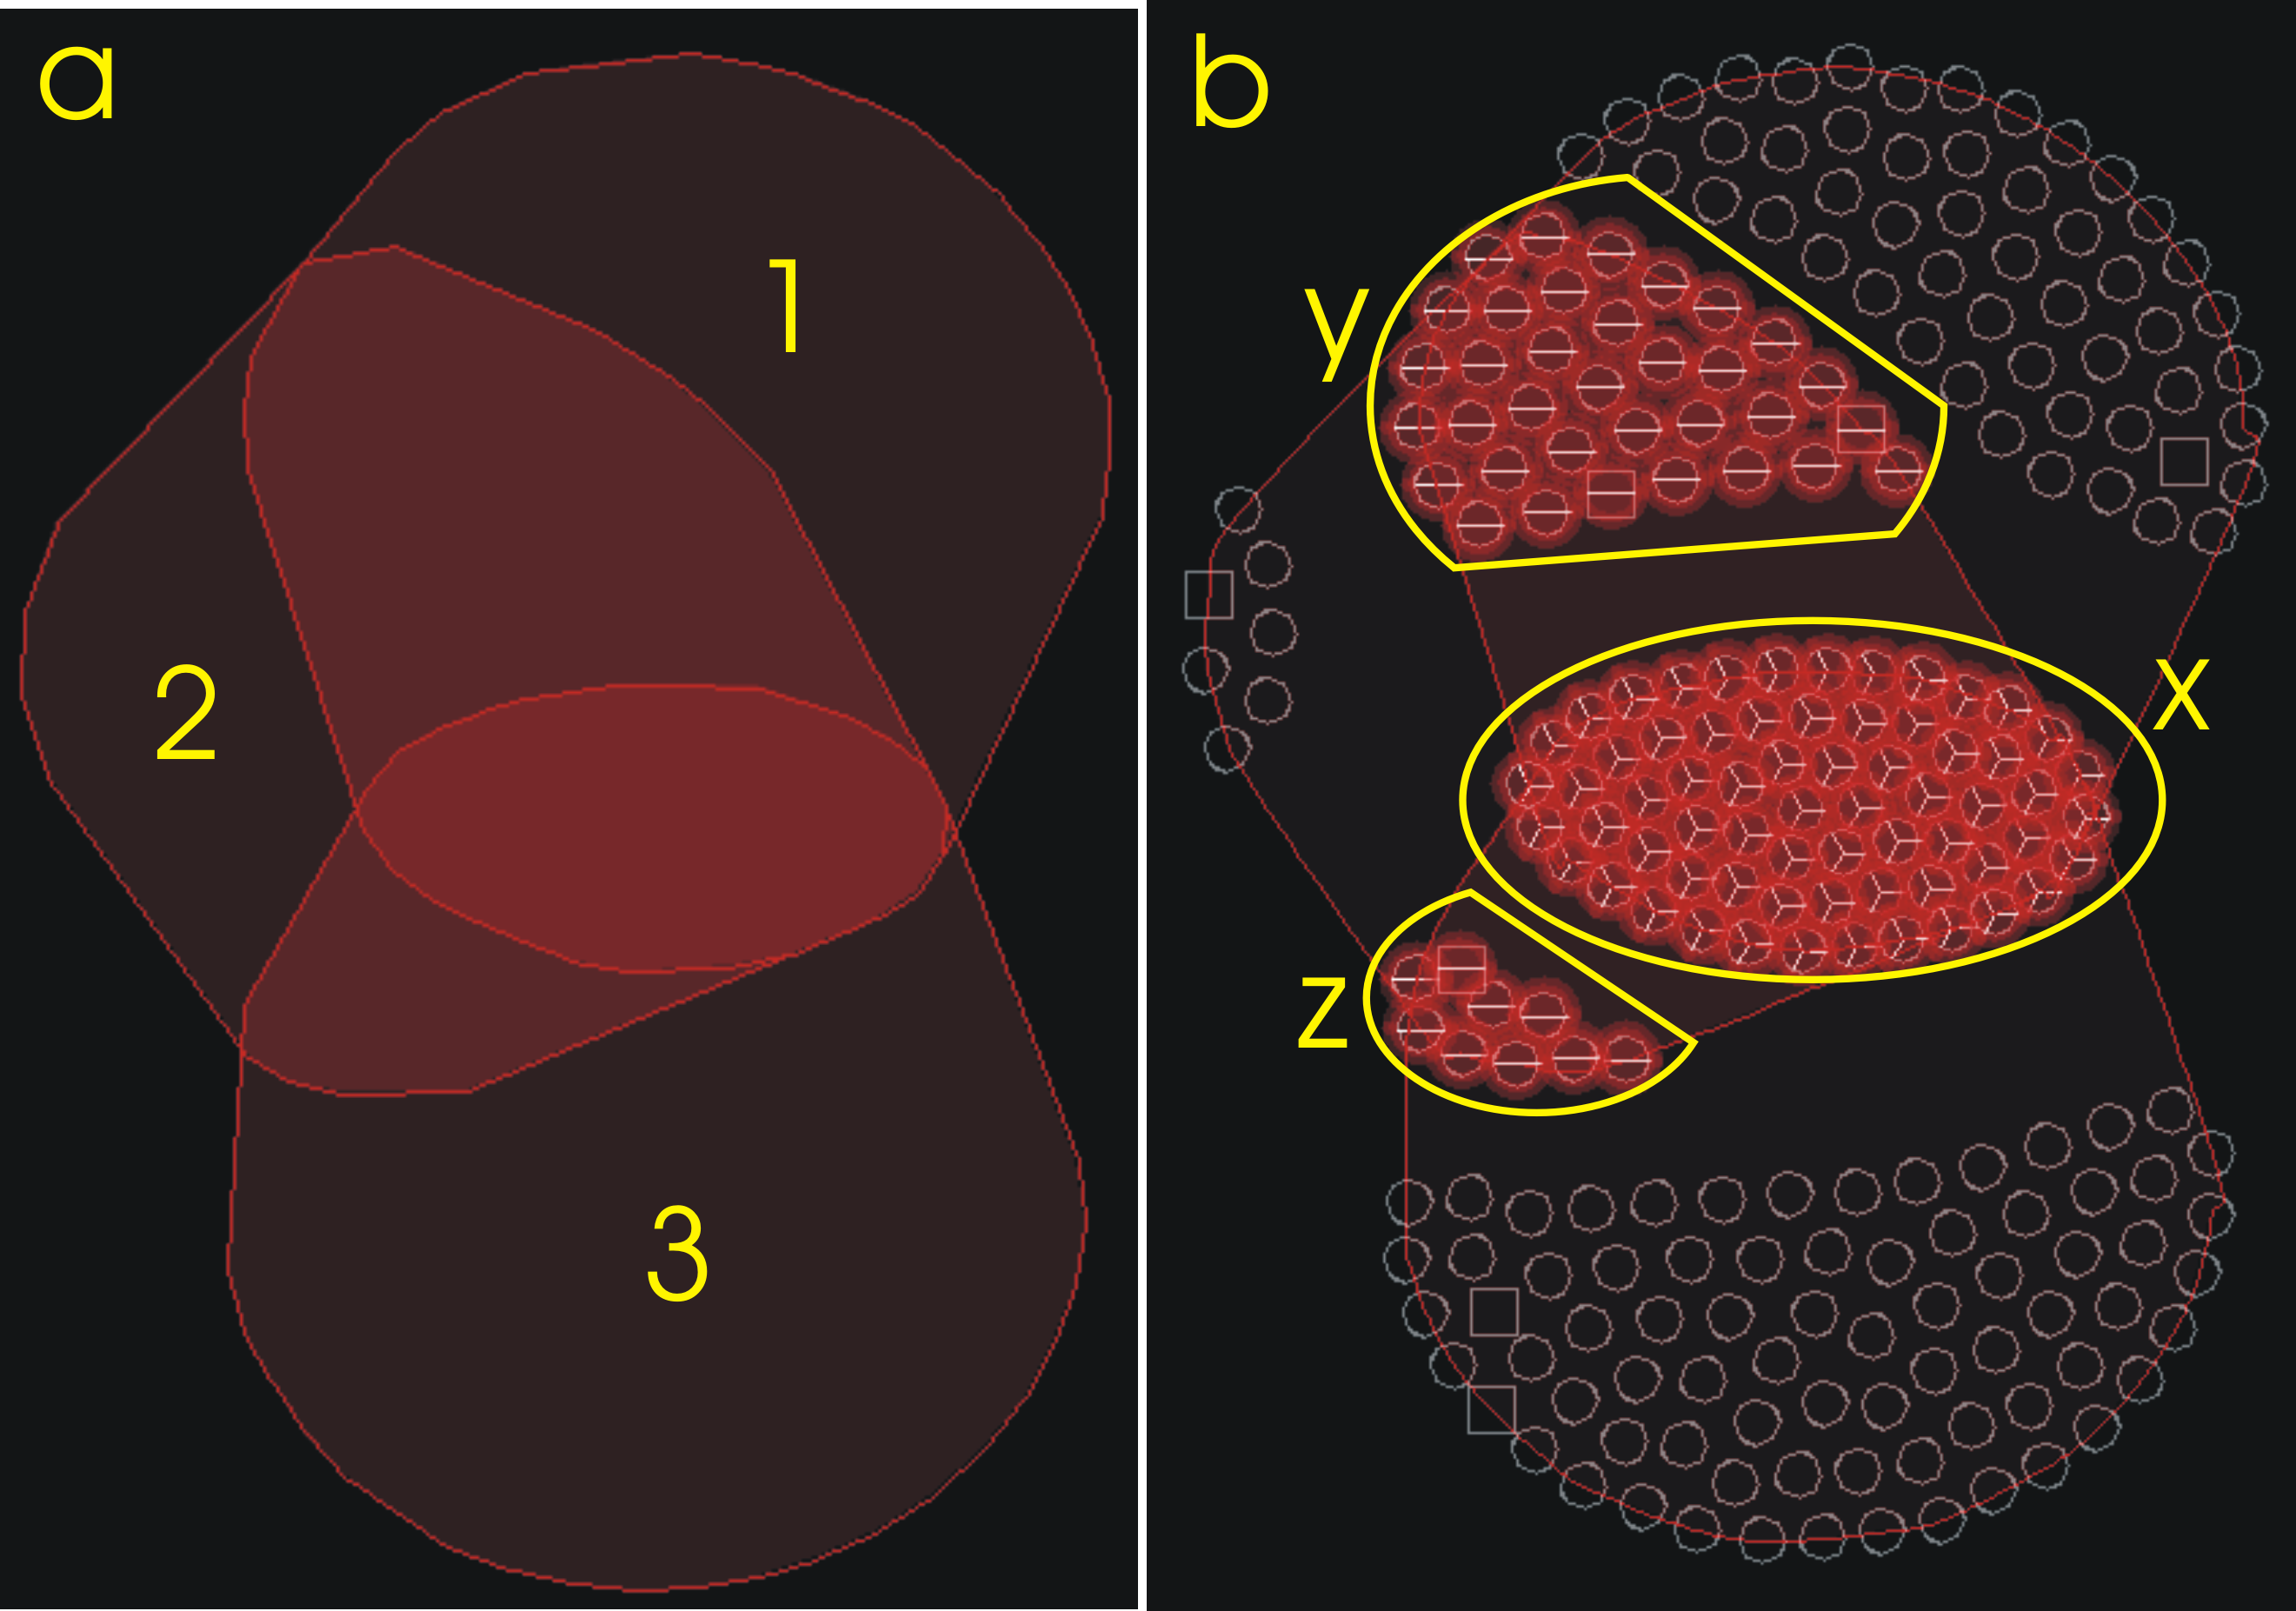
Three biclusters overlapped. There is a common area for the three and areas shared by 1, 2 and 2, 3. The tool capability to highlight this kind of superstructures (we will call them 'superbiclusters') in biclustering results is one of their most intereseting features.
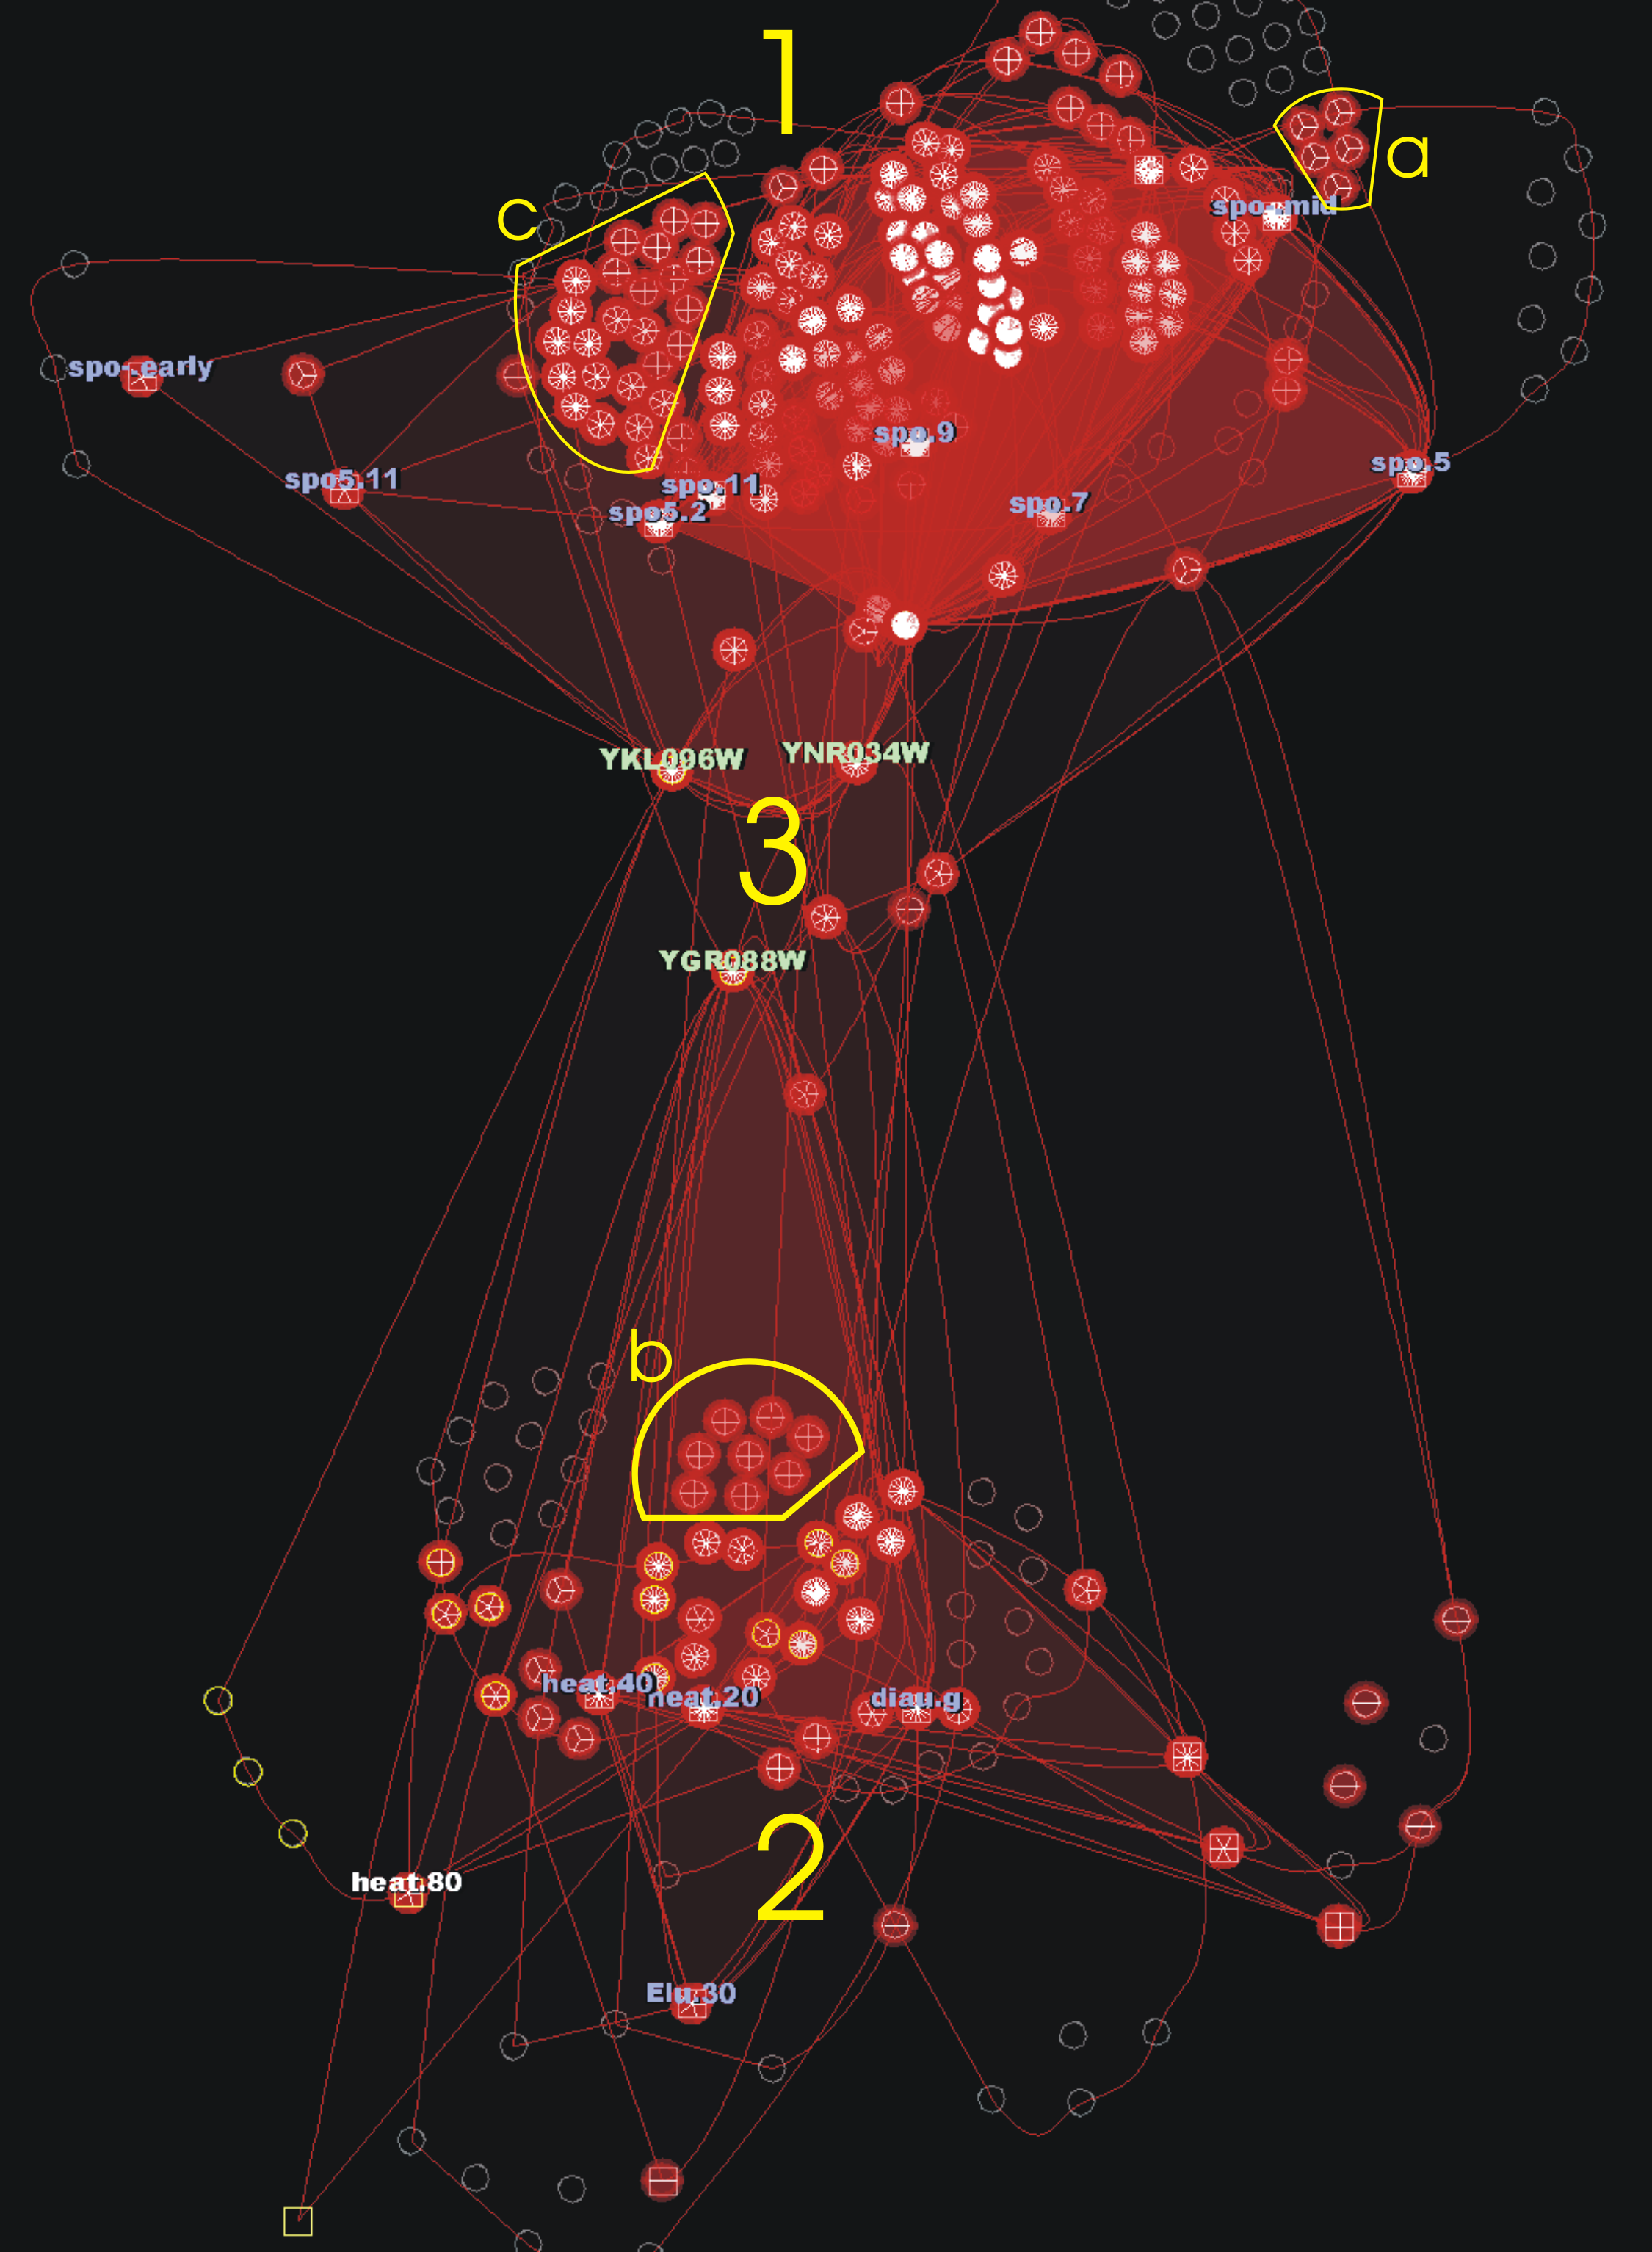
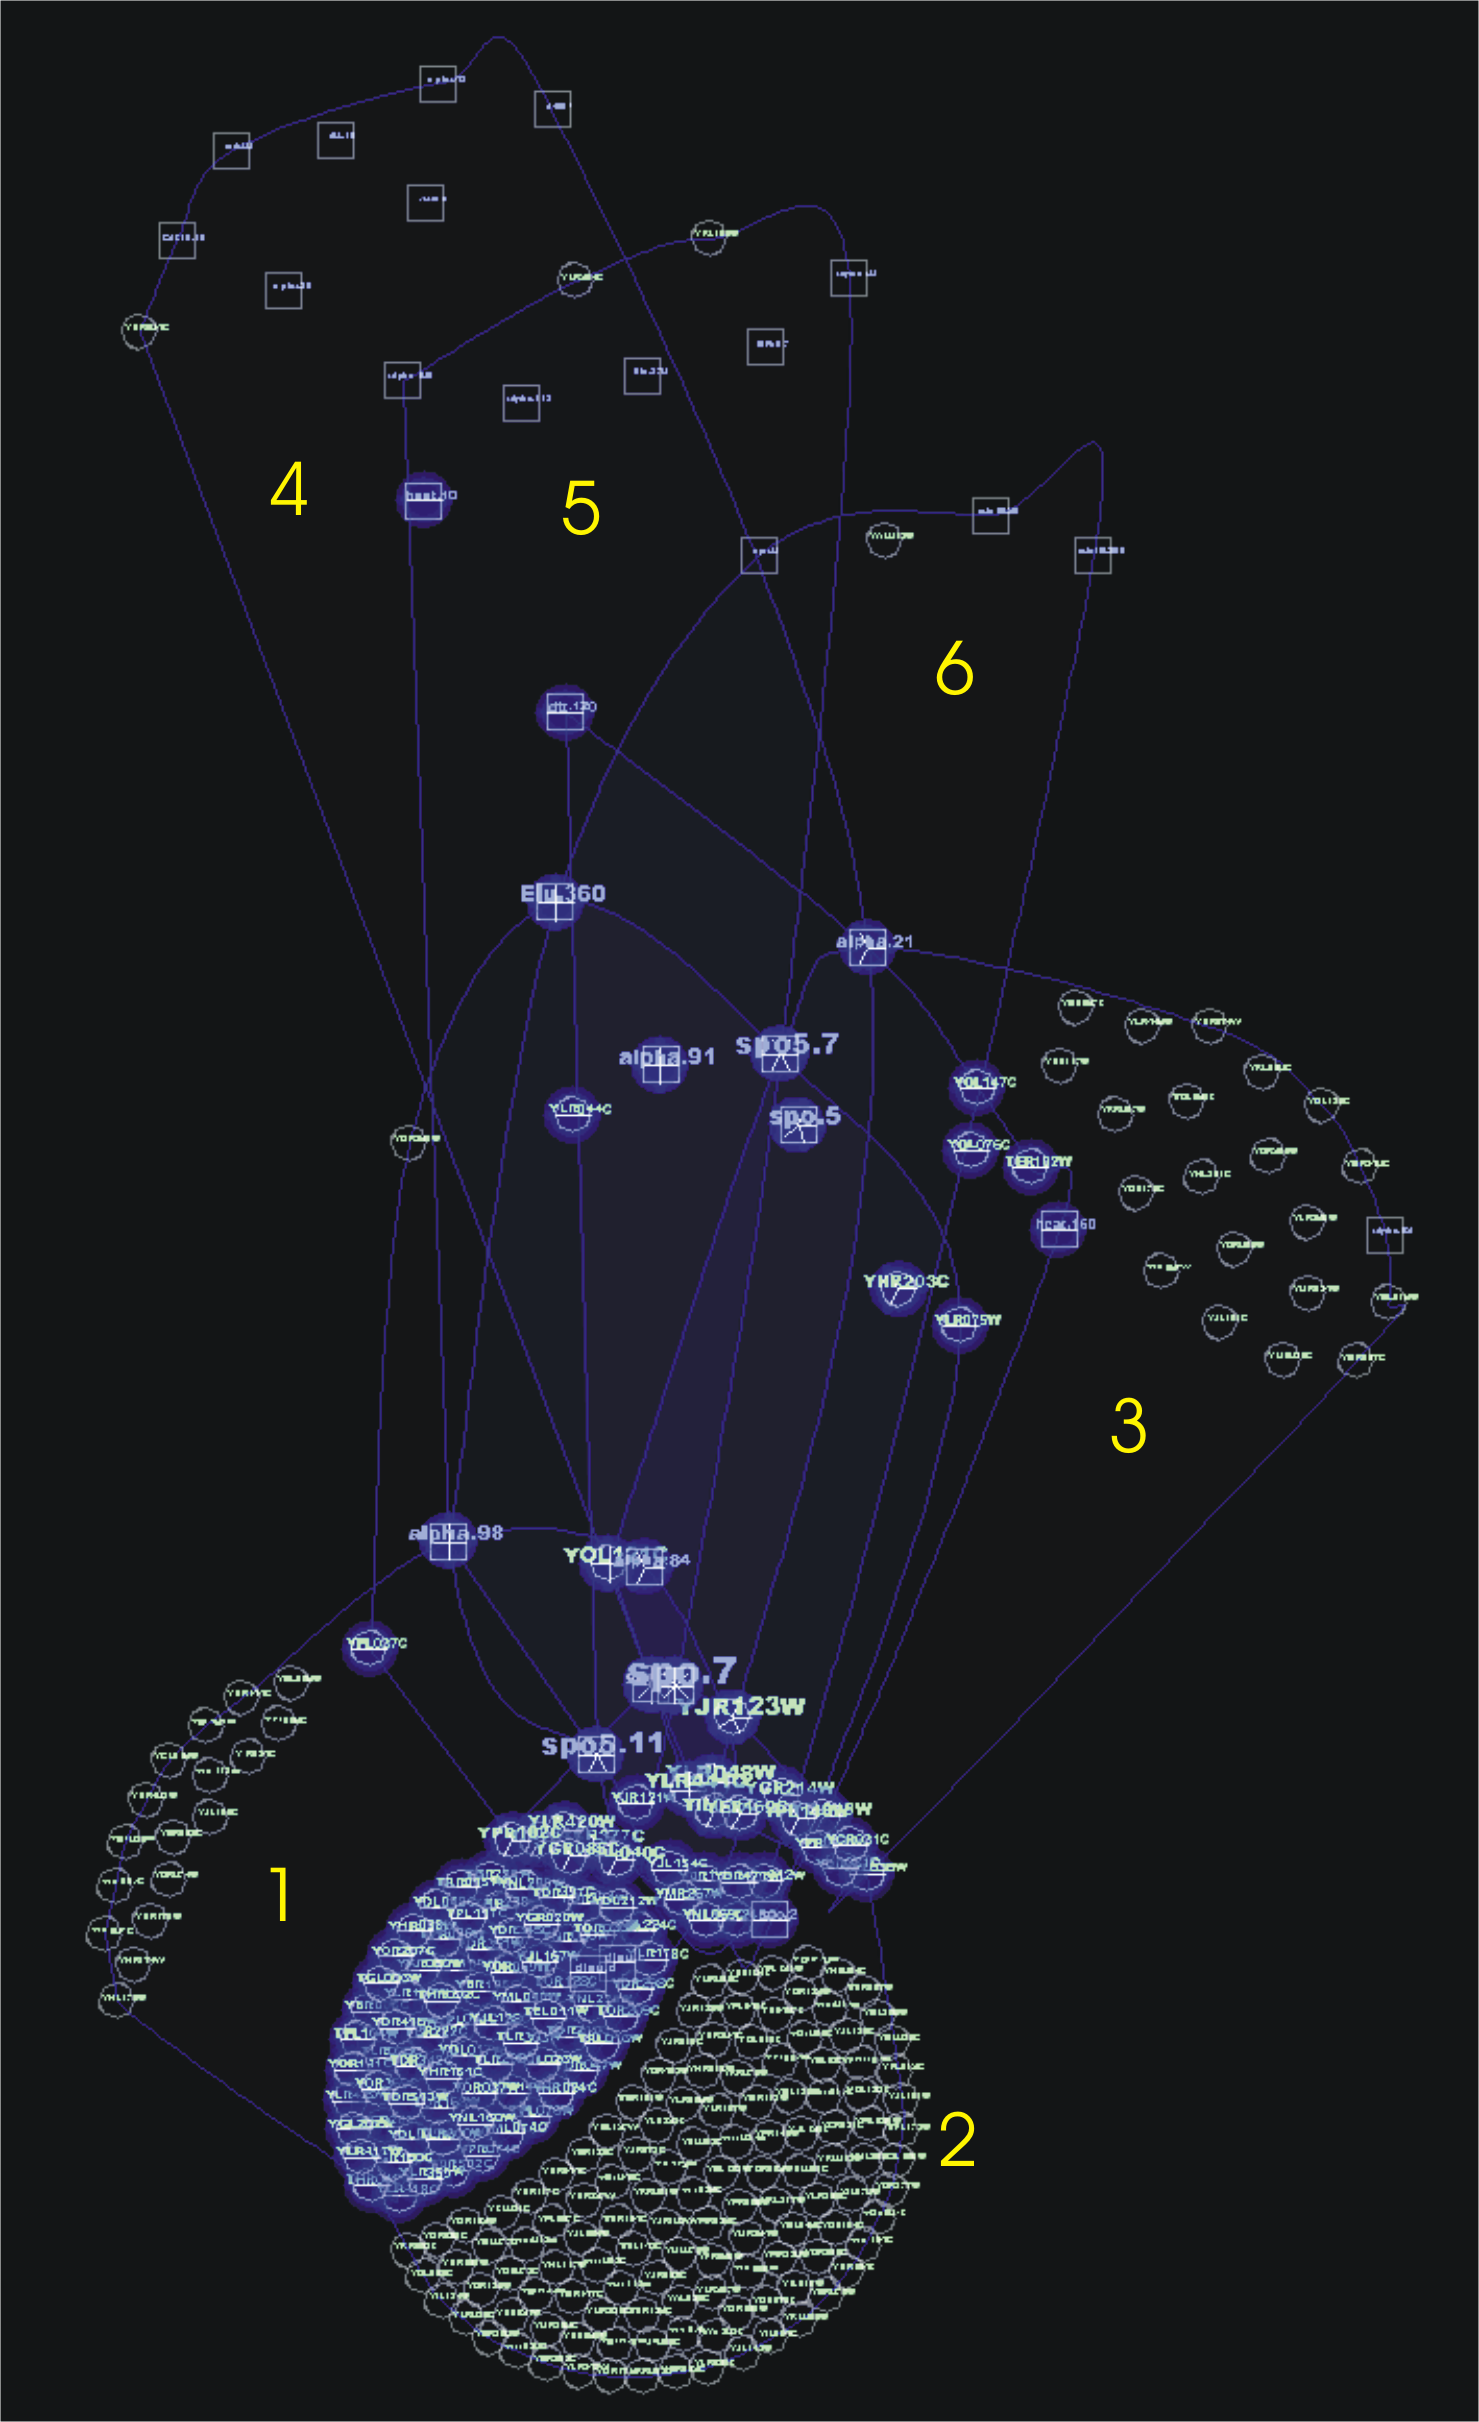
Representation of the 100 biggest biclusters (left) and 50 biggest biclusters (right) of Bimax for Eisen yeast microarray data. Two groups appear at top (1) and bottom (2) of the figures, with only some genes active in both. The addition of biclusters make groups tighter, reflecting the exhaustiveness of Bimax (much of the biclusters found are very similar).
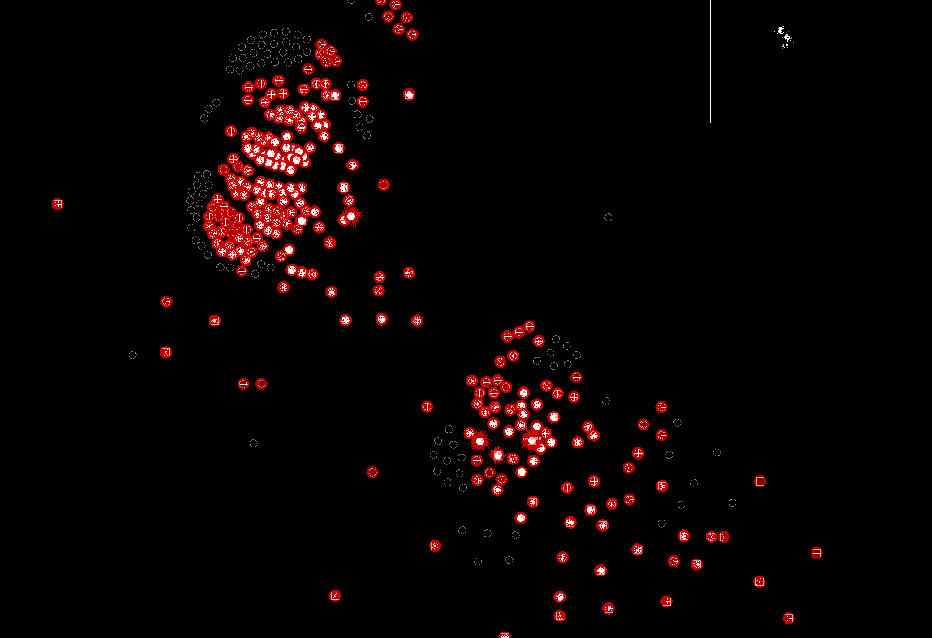 Same example, but up to 250 biclusters!. The groupings are still clear, even clearer without hulls. Some genes and conditions reveals as really important for Bimax (piecharts with lots of radial lines).
If only conditions are represented, the two groups are unconnected, and visualization is simplified. Now it's even clearer than sporulation conditions and heat conditions are the ones that cause over-expression, since this is the criterium for Bimax biclustering. It's interesting how heat.0 is related to sporulation conditions and not to the heat conditions.
OPSM on yeast
OPSM searches for coherent evolution biclusters, finding only about a dozen in our Saccharomyces Cerevisiae example.
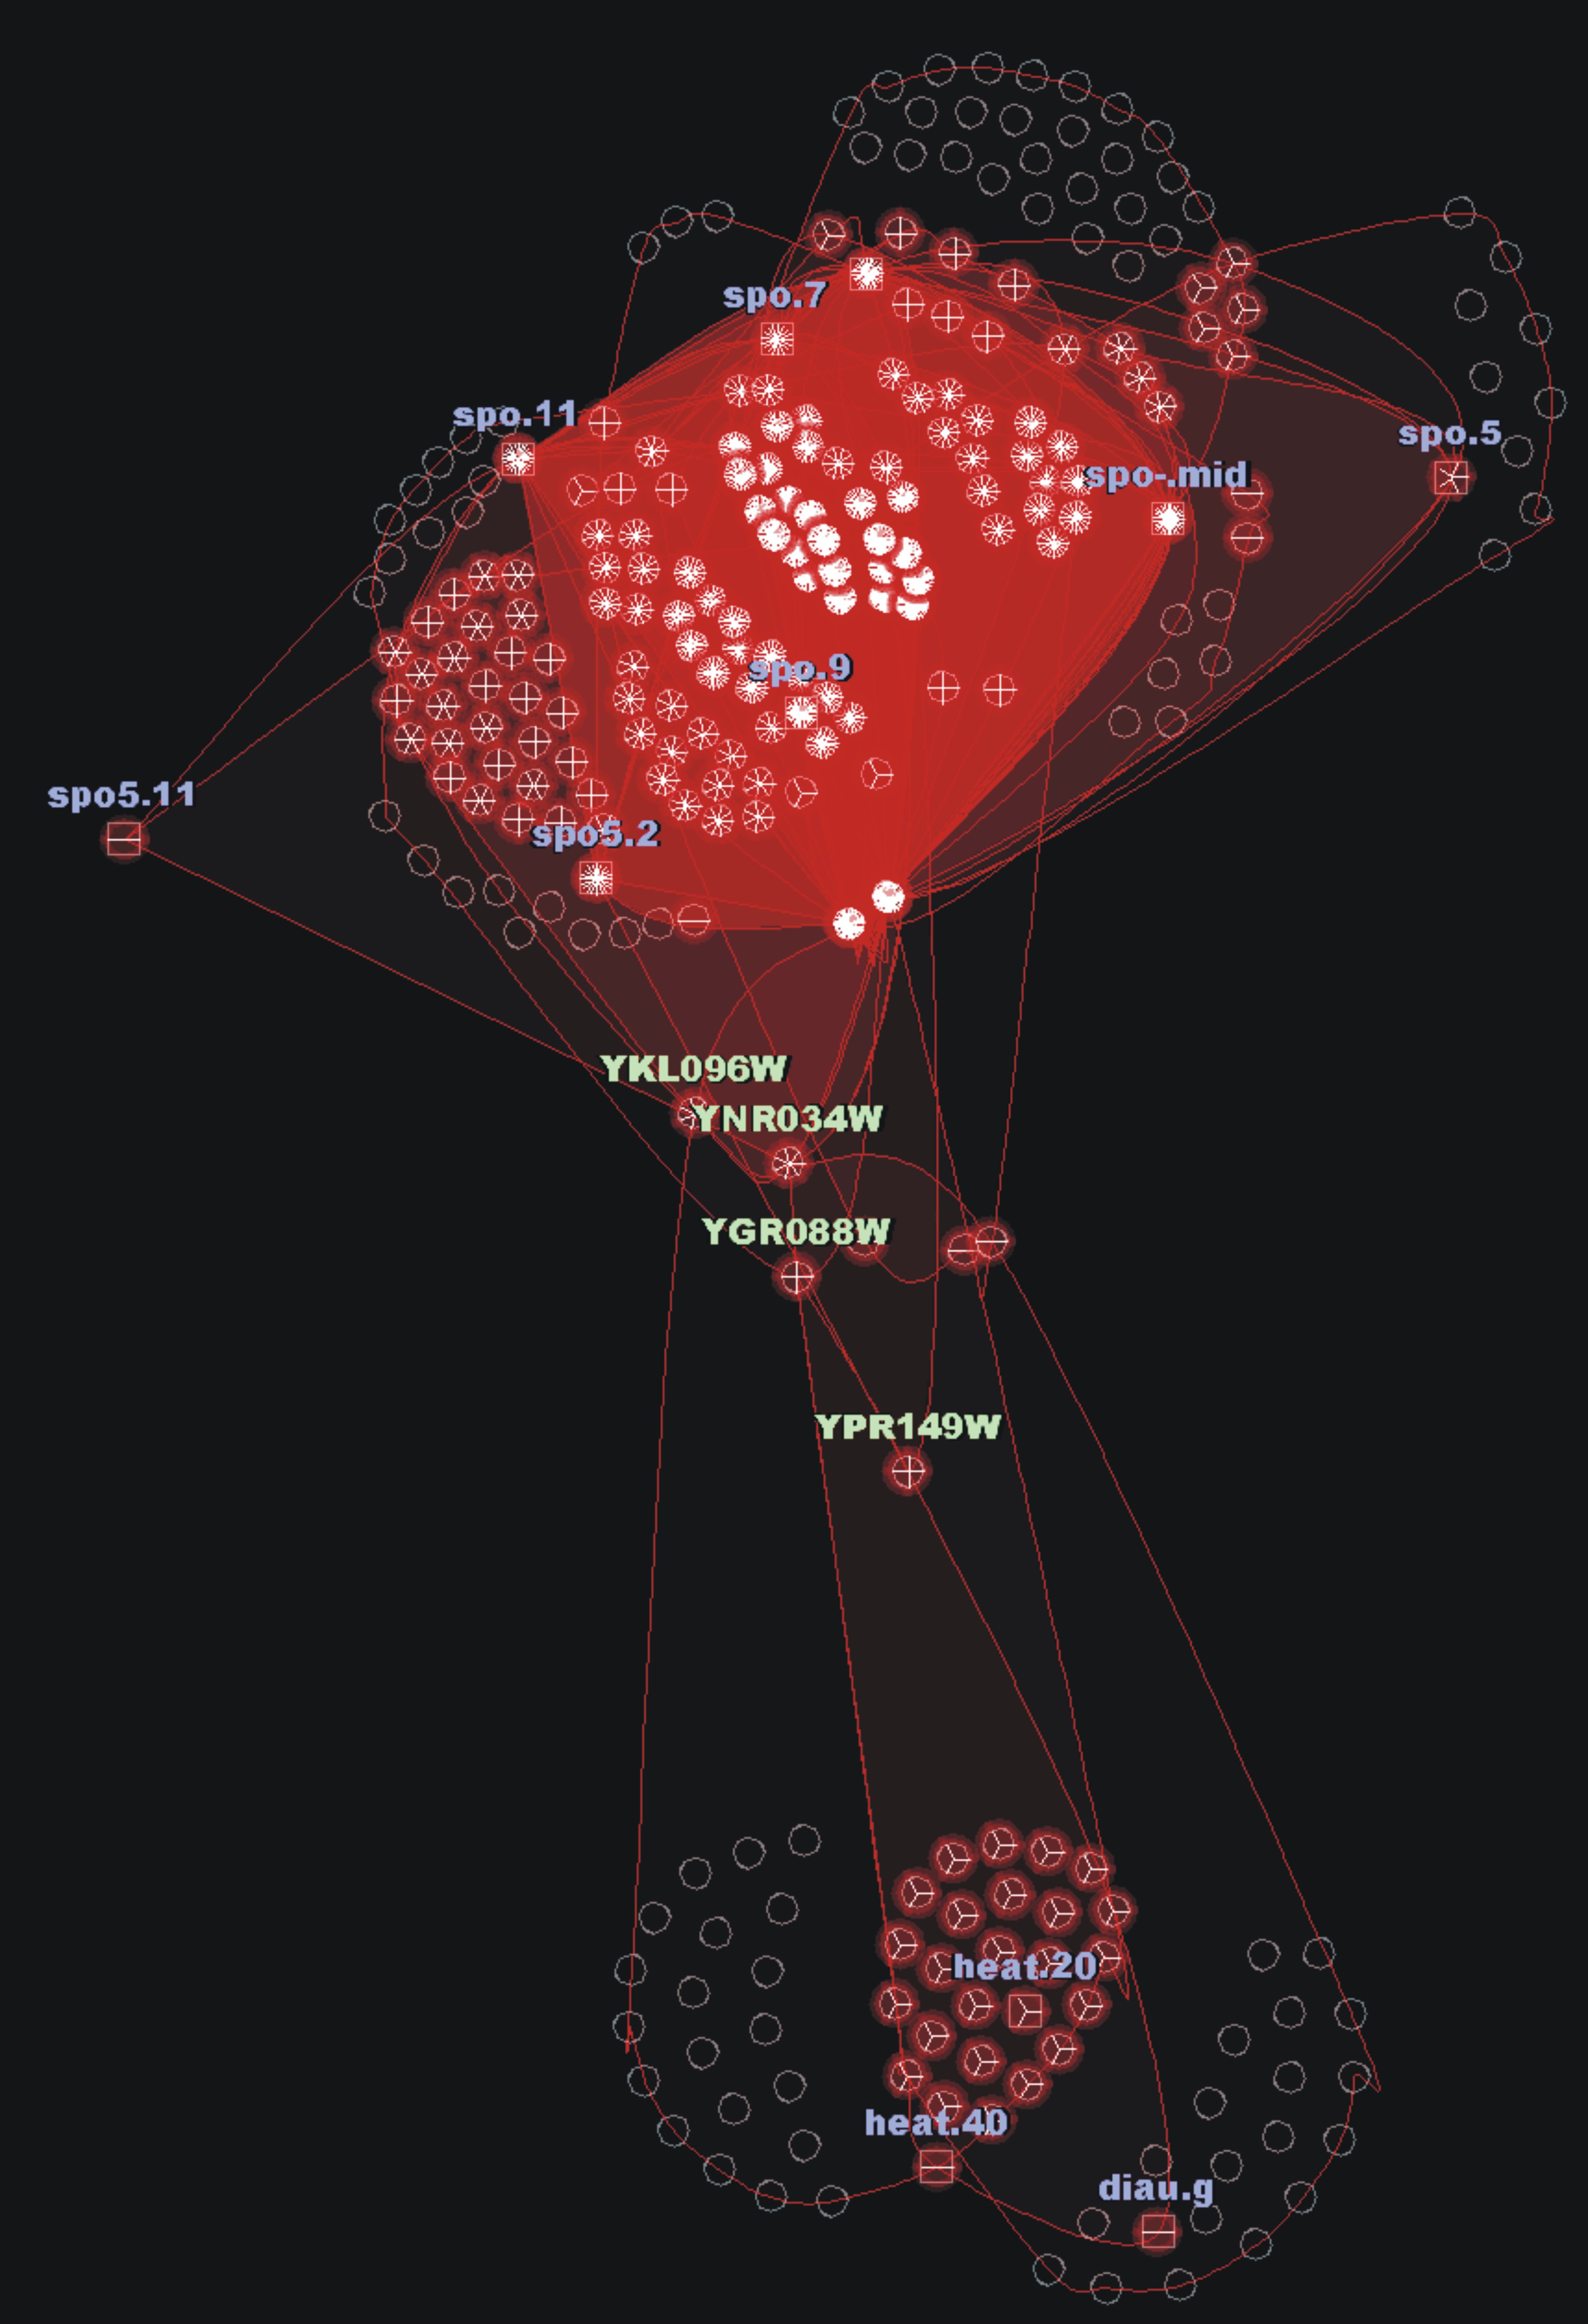
OPSM groups biclusters with large number of genes (1, 2, 3) or conditions (4, 5, 6). Some conditions are important for OPSM, as for example spo.7, that is also important for Bimax
Iterative Search Algorithms finds about 50 biclusters for the above yeast example. ISA searches for very high or low expression levels. The resulting biclusters are more entangled than those of OPSM, but less than Bimax.
50 biclusters from ISA. Separate 'green balls' of genes and conditions appear, revealing interesting groups under ISA criteria. Isolated genes and conditions act as nexus between these super-biclusters
An
interesting feature is sporulation conditions, highly biclustered by Bimax and also by OPSM. For ISA, sporulation is less important, appearing only in three, low connected biclusters.
Once we are capable of showing simultaneously different biclusters from one method, the next obvious step is to compare the set of biclusters of two or more biclusterings. Here there are some images of the preliminary results of applying the same method unchanged, only using color to distinguish algorithms.
Bimax (red) and OPSM (blue). Both structures now overlap in some points, mainly in sporulation conditions. Now piecharts show colored sections that details the number of times that the corresponding node appear in a bicluster of the corresponding set.
Now conditions biclustered by Bimax (red), ISA (blue) and OPSM (green) are represented. Visualization simplifies greatly at the cost of losing gene information. We can see that OPSM groups only a small set of conditions while ISA selects almost everyone at least once. Bimax biclusters are separated in two subgroups when talking on conditions. Note, for example, how heat.0 at the top of Bimax red zone is highly biclustered by Bimax (over-expression criteria) but rarely biclustered by ISA (highly over or under-expression criteria) and never by OPSM (order criteria). One can conclude that heat.0 makes genes to overexpress along with sporulation conditions, but rarery to very high levels and never on an ordered way.